Retail & eCommerce
Demand forecasting, basket analysis, and inventory dashboards that warn before shelves run empty. How much margin do you lose when the wrong SKU wins?
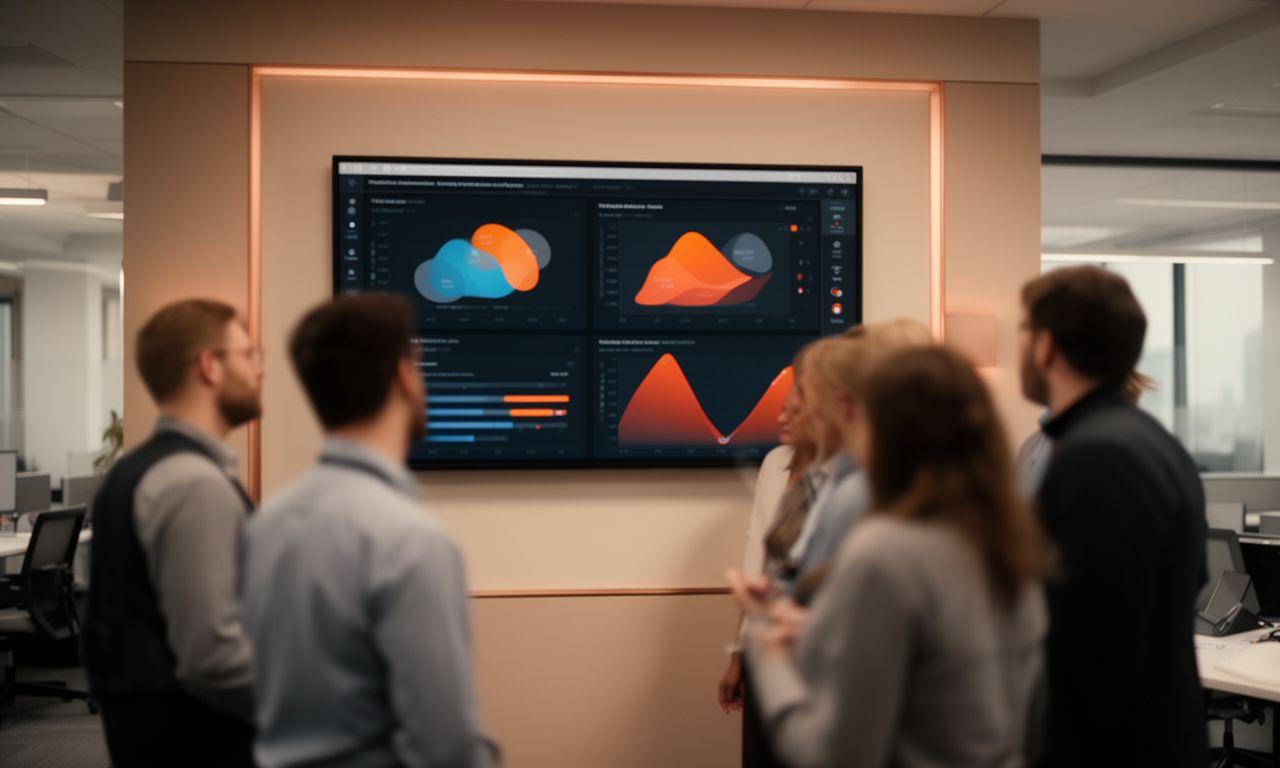
Predictive analytics doesn’t behave the same in retail, finance, manufacturing, or healthcare administration. Why should your reporting stack? Verdant Insight builds dashboards around the signals you already trust, then layers custom AI model integration on top so the numbers mean something before a problem lands on your desk.
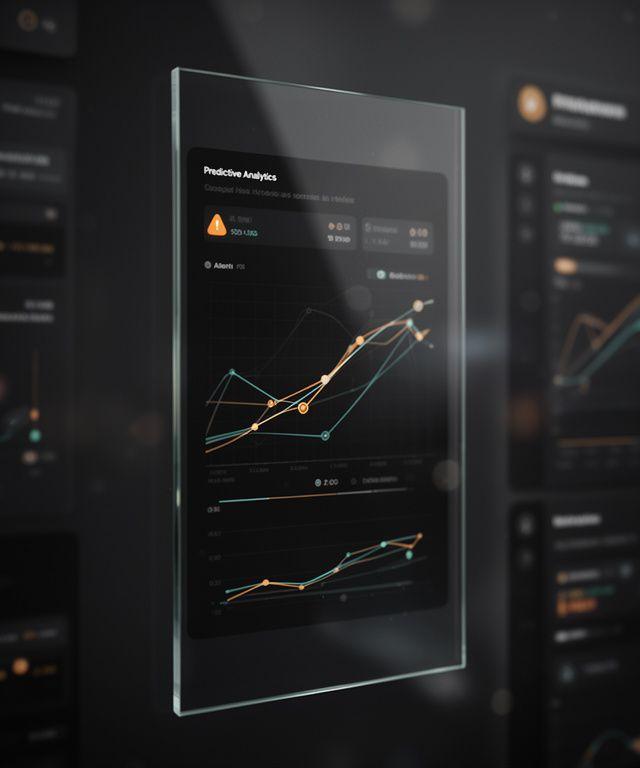
What if your next decision arrived sooner?
Sectors we serve
Each industry has its own rhythm. Stock moves, service KPIs, maintenance windows, compliance checkpoints. Which numbers matter most to you?
Demand forecasting, basket analysis, and inventory dashboards that warn before shelves run empty. How much margin do you lose when the wrong SKU wins?
Live revenue monitoring, pipeline health, and client performance views built for teams that need clarity fast. One glance. That’s the brief.
Predictive maintenance, line performance, and supply chain visibility that spot bottlenecks before they snowball. What if the warning came before downtime?
Operational efficiency dashboards that reduce admin drag, highlight service delays, and keep teams focused on patient-facing work. Less chasing, more doing.
If your business runs on messy, valuable data, we’ll shape it into something readable. Why force a generic dashboard into a specialist workflow?
Live status boards and anomaly detection for operations that can’t wait until Monday morning. The point is simple: see it early, act early.
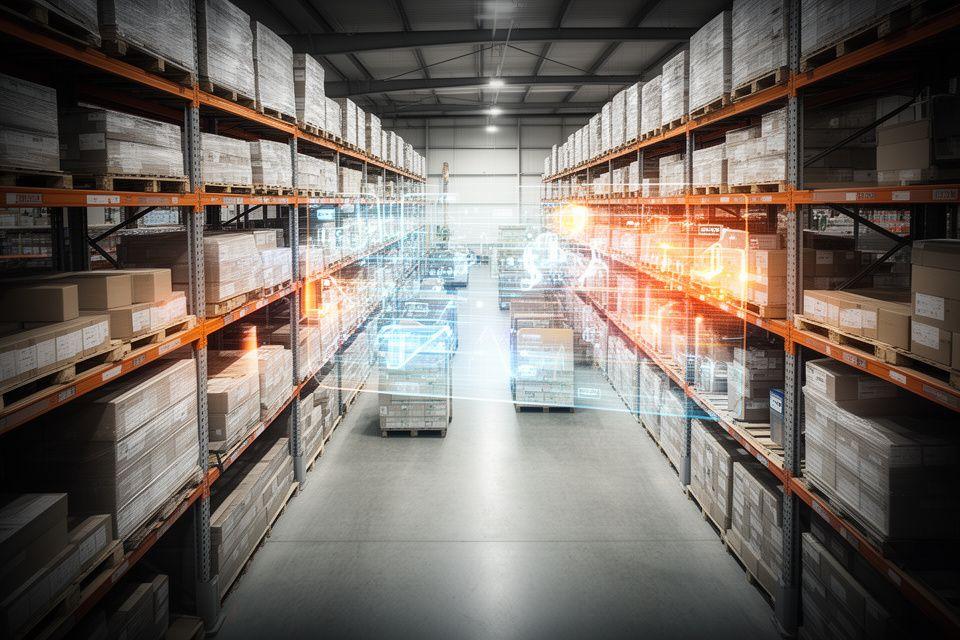
Automated warnings reduce overstock and understock without burying your team in spreadsheets.
Forecasts show what’s coming next, not just what already happened.
Real problems, real dashboards
A good dashboard doesn’t just display numbers. It prevents avoidable pain. Our clients use dashboards to stop a stock miss before it hits customers, catch equipment anomalies before failure, and give finance teams a revenue view they can trust.
Procurement teams see replenishment thresholds clearly. Nobody likes a surprise shortage, right?
Maintenance teams can prioritise repair work before a line goes dark.
Finance leaders get a clearer view of forecast risk, pipeline movement, and likely close dates.
Teams stop reacting to noise. They start acting on signals. That’s the difference between a dashboard people admire and one people use.
Client view
We design the layout, the thresholds, and the routing logic around your team’s decisions. What gets missed today? We build for that.
Testimonials
The right dashboard changes the meeting. The right AI model changes the decision. Which one do you need this quarter?
The stock view finally matches how our buying team works. We stopped arguing over spreadsheets and started fixing the gaps. That shift was immediate.
Why did we choose Verdant Insight? Because the team translated our reporting mess into something our partners actually trust. The forecast board now tells a useful story.
The anomaly alerts saved our maintenance team from a weekend outage. We needed something practical, not flashy, and that’s exactly what we got.
Don't see your industry?
Verdant Insight works best when the business has real complexity. Multiple systems. Messy operational signals. A few stakeholders who all want different answers. That’s normal. We map the workflow, shape the dashboard, and integrate the AI around the decisions that matter most.
10 Rounds Green Road, Sandwell, West Midlands, B69 2BU, UK
+447825681507